Skip to content

SAT practice test

One-variable data: Distributions and measures of center and spread

  • 71 questions
  • Untimed
  • Answers and explanations
Embed on your site
  • 71 questions
  • No time limit
  • Every answer explained at the end
  1. Question 1

    The median of the scores for group B is how much greater than the median of the scores for group A?

    Correct answer: C

    The correct answer is 1. When there are an odd number of values in a data set, the median of the data set is the middle number when the data values are ordered from least to greatest. The scores for group A, ordered from least to greatest, are 2, 3, 4, 4, 5, 6, 6, 6, and 9. The median of the scores for group A is therefore 5. The scores for group B, ordered from least to greatest, are 5, 5, 5, 5, 6, 6, 8, 8, 9, 10, and 10. The median of the scores for group B is therefore 6. The median score for group B is more than the median score for group A.
  2. Question 2

    The table above shows the number of students from two different high schools who completed summer internships in each of five years. No student attended both schools. Which of the following statements are true about the number of students who completed summer internships for the 5 years shown?The mean number from Foothill High School is greater than the mean number from Valley High School.The median number from Foothill High School is greater than the median number from Valley High School.

    Correct answer: C

    Choice C is correct. The mean of a data set is found by dividing the sum of the values by the number of values. Therefore, the mean number of students who completed summer internships from Foothill High School is, or 77.6. Similarly, the mean number from Valley High School is, or 64.2. Thus, the mean number from Foothill High School is greater than the mean number from Valley High School. When a data set has an odd number of elements, the median can be found by ordering the values from least to greatest and determining the value in the middle. Since there are five values in each data set, the third value in each ordered list is the median. Therefore, the median number from Foothill High School is 76 and the median number from Valley High School is 65. Thus, the median number from Foothill High School is greater than the median number from Valley High School.Choices A, B, and D are incorrect and may result from various misconceptions or miscalculations.
  3. Question 3

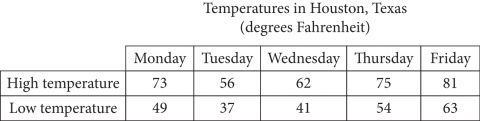
    Over this 5-day period, which of the following is NOT equal to 81°F?

    Correct answer: D

    Choice D is correct. The range of a data set is the difference between the maximum and the minimum values in the set. The maximum value among the high temperatures in the table is 82°F and the minimum value is 80°F. Therefore, the range is 82°F – 80°F = 2°F.Choice A is incorrect. The median of a data set is the middle value when the values in the set are ordered from least to greatest. Ordering the high temperatures this way gives the list 80, 81, 81, 81, 82. Therefore, the median high temperature is 81°F. Choice B is incorrect. The mean high temperature is . Choice C is incorrect. The mode is the value that occurs the greatest number of times. For the set of high temperatures shown, 81 is the value that occurs 3 times, and therefore, 81°F is the mode of the high temperatures.
  4. Question 4

    Andrew and Maria each collected six rocks, and the masses of the rocks are shown in the table above. The mean of the masses of the rocks Maria collected is 0.1 kilogram greater than the mean of the masses of the rocks Andrew collected. What is the value of x ?

    Correct answer: A

    The correct answer is 2.6. Since the mean of a set of numbers can be found by adding the numbers together and dividing by how many numbers there are in the set, the mean mass, in kilograms, of the rocks Andrew collected is, or 2.8. Since the mean mass of the rocks Maria collected is 0.1 kilogram greater than the mean mass of rocks Andrew collected, the mean mass of the rocks Maria collected is kilograms. The value of x can be found by writing an equation for finding the mean: . Solving this equation gives . Note that 2.6 and 13/5 are examples of ways to enter a correct answer.
  5. Question 5

    The mean of the list of numbers above is what fraction of the sum of the five numbers?

    Correct answer: D

    The correct answer is . The mean of the list of numbers is found by dividing the sum of the numbers by the number of values in the list. Since there are 5 numbers in the list, the mean is of the sum of the numbers. Note that 1/5 and .2 are examples of ways to enter a correct answer.
  6. Question 6

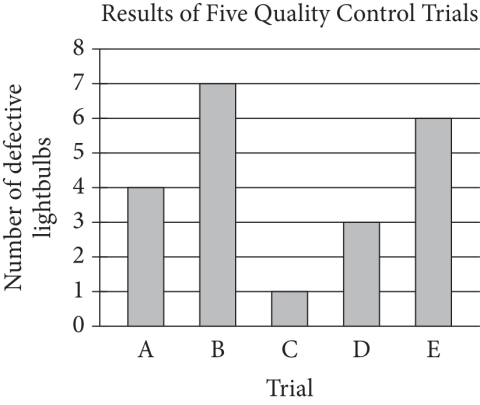
    For quality control, a company that manufactures lightbulbs conducted five different trials. In each trial, 500 different lightbulbs were tested. The bar graph above shows the number of defective lightbulbs found in each trial. What is the mean number of defective lightbulbs for the five trials?

    Correct answer: B

    Choice B is correct. The numbers of defective lightbulbs found for the five trials are 4, 7, 1, 3, and 6, respectively. The mean is therefore .Choice A is incorrect. This is the median number of defective lightbulbs for the five trials. Choice C is incorrect and may result from an arithmetic error. Choice D is incorrect and may result from mistaking the number of trials for the number of defective lightbulbs.
  7. Question 7

    A fish hatchery has three tanks for holding fish before they are introduced into the wild. Ten fish weighing less than 5 ounces are placed in tank A. Eleven fish weighing at least 5 ounces but no more than 13 ounces are placed in tank B. Twelve fish weighing more than 13 ounces are placed in tank C. Which of the following could be the median of the weights, in ounces, of these 33 fish?

    Correct answer: B

    Choice B is correct. The median of a set of numbers is the middle number when the values in the set are ordered from least to greatest. There are 33 fish, so in an ordered list of the weights, the 17th value would be the median weight. The 10 fish in tank A weigh the least, and these 10 weights would be the first 10 values on the ordered list. The 11 fish in tank B have the next set of higher weights, and so would be the 11th through 21st weights in the ordered list, which includes the median weight as the 17th value. The fish in tank B weigh at least 5 ounces but no more than 13 ounces; of the given choices, only 8 ounces falls within this range of values.Choice A is incorrect. It’s given that tank A has ten fish weighing less than 5 ounces. Since there are more than ten fish in tanks B and C combined, the median weight cannot be less than 5 ounces. Choice C and D are incorrect. It’s given that tank C has twelve fish weighing more than 13 ounces. There are more than twelve fish in tanks A and B combined, so the median weight can’t be more than 13 ounces.
  8. Question 8

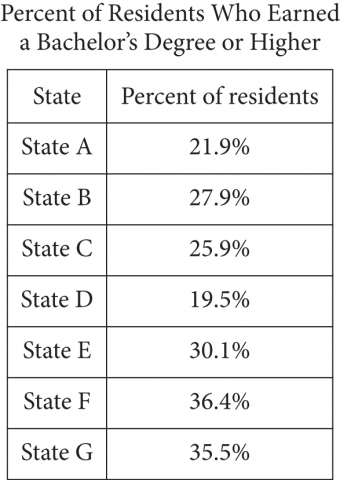
    A survey was given to residents of all 50 states asking if they had earned a bachelor’s ° or higher. The results from 7 of the states are given in the table above. The median percent of residents who earned a bachelor’s ° or higher for all 50 states was 26.95%. What is the difference between the median percent of residents who earned a bachelor’s ° or higher for these 7 states and the median for all 50 states?

    Correct answer: B

    Choice B is correct. The median of a set of numbers is the middle value of the set values when ordered from least to greatest. If the percents in the table are ordered from least to greatest, the middle value is 27.9%. The difference between 27.9% and 26.95% is 0.95%.Choice A is incorrect and may be the result of calculation errors or not finding the median of the data in the table correctly. Choice C is incorrect and may be the result of finding the mean instead of the median. Choice D is incorrect and may be the result of using the middle value of the unordered list.
  9. Question 9

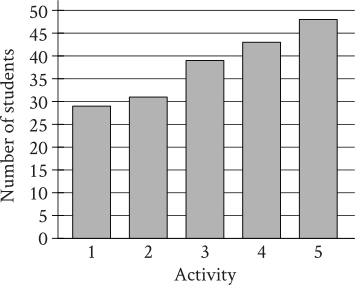
    The data for the 5 categories are as follows: 1: More than halfway above 25 students 2: Less than halfway above 30 students 3: More than halfway above 35 students 4: About halfway above 40 students 5: About halfway above 45 students A group of students voted on five after-school activities. The bar graph shows the number of students who voted for each of the five activities. How many students chose activity \(3\)?

    Correct answer: B

    Choice B is correct. The height of each bar in the bar graph given represents the number of students that voted for the activity specified at the bottom of the bar. The bar for activity \(3\) has a height that is between \(35\) and \(40\). In other words, the number of students that chose activity \(3\) is between \(35\) students and \(40\) students. Of the given choices, \(39\) is the only value between \(35\) and \(40\). Therefore, \(39\) students chose activity \(3\). Choice A is incorrect and may result from conceptual errors. Choice C is incorrect. This is the number of students that chose activity \(5\), not activity \(3\). Choice D is incorrect and may result from conceptual errors.
  10. Question 10

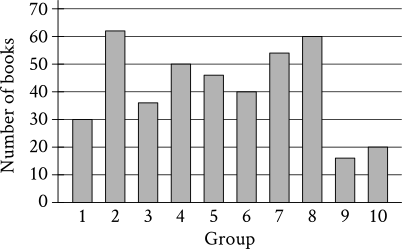
    The data for the 10 categories are as follows: Group 1: 30 Group 2: 62 Group 3: 36 Group 4: 50 Group 5: 46 Group 6: 40 Group 7: 54 Group 8: 60 Group 9: 16 Group 10: 20 The bar graph shows the distribution of \(414\) books collected by \(10\) different groups for a book drive. How many books were collected by group \(1\)?

    Correct answer: B

    The correct answer is \(30\). The height of each bar in the bar graph shown represents the number of books collected by the group specified at the bottom of the bar. The bar for group \(1\) reaches a height of \(30\). Therefore, group \(1\) collected \(30\) books.
  11. Question 11

    Data set A consists of the heights of \(75\) buildings and has a mean of \(32\) meters. Data set B consists of the heights of \(50\) buildings and has a mean of \(62\) meters. Data set C consists of the heights of the \(125\) buildings from data sets A and B. What is the mean, in meters, of data set C?

    Correct answer: C

    The correct answer is \(44\). The mean of a data set is computed by dividing the sum of the values in the data set by the number of values in the data set. It's given that data set A consists of the heights of \(75\) buildings and has a mean of \(32\) meters. This can be represented by the equation \(x/75 = 32\), where \(x\) represents the sum of the heights of the buildings, in meters, in data set A. Multiplying both sides of this equation by \(75\) yields \(x = 75(32)\), or \(x = 2,400\) meters. Therefore, the sum of the heights of the buildings in data set A is \(2,400\) meters. It's also given that data set B consists of the heights of \(50\) buildings and has a mean of \(62\) meters. This can be represented by the equation \(y/50 = 62\), where \(y\) represents the sum of the heights of the buildings, in meters, in data set B. Multiplying both sides of this equation by \(50\) yields \(y = 50(62)\), or \(y = 3,100\) meters. Therefore, the sum of the heights of the buildings in data set B is \(3,100\) meters. Since it's given that data set C consists of the heights of the \(125\) buildings from data sets A and B, it follows that the mean of data set C is the sum of the heights of the buildings, in meters, in data sets A and B divided by the number of buildings represented in data sets A and B, or \(2,400 + 3,100/125\), which is equivalent to \(44\) meters. Therefore, the mean, in meters, of data set C is \(44\).
  12. Question 12

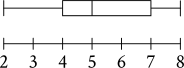
    From left to right the values of the vertical bars in the box plot are as follows: First vertical bar: 2 Second vertical bar: 4 Third vertical bar: 5 Fourth vertical bar: 7 Fifth vertical bar: 8 The box plot summarizes \(15\) data values. What is the median of this data set?

    Correct answer: C

    Choice C is correct. The median of a data set represented in a box plot is given by the vertical line within the box. In the given box plot, the vertical line within the box occurs at \(5\). Therefore, the median of this data set is \(5\). Choice A is incorrect. This is the minimum value of the data set. Choice B is incorrect and may result from conceptual errors. Choice D is incorrect. This is the maximum value of the data set.
  13. Question 13

    Data set F consists of \(55\) integers between \(170\) and \(290\). Data set G consists of all the integers in data set F as well as the integer \(10\). Which of the following must be less for data set F than for data set G? The mean The median

    Correct answer: D

    Choice D is correct. It's given that data set F consists of \(55\) integers between \(170\) and \(290\) and data set G consists of all the integers in data set F as well as the integer \(10\). Since the integer \(10\) is less than all the integers in data set F, the mean of data set G must be less than the mean of data set F. Thus, the mean of data set F isn't less than the mean of data set G. When a data set is in ascending order, the median is between the two middle values when there is an even number of values and the median is the middle value when there is an odd number of values. It follows that the median of data set F is either greater than or equal to the median of data set G. Therefore, the median of data set F isn't less than the median of data set G. Thus, neither the mean nor the median must be less for data set F than for data set G. Choice A is incorrect and may result from conceptual or calculation errors. Choice B is incorrect and may result from conceptual or calculation errors. Choice C is incorrect and may result from conceptual or calculation errors.
  14. Question 14

    Data set A consists of the heights of \(75\) objects and has a mean of \(25\) meters. Data set B consists of the heights of \(50\) objects and has a mean of \(65\) meters. Data set C consists of the heights of the \(125\) objects from data sets A and B. What is the mean, in meters, of data set C?

    Correct answer: A

    The correct answer is \(41\). The mean of a data set is computed by dividing the sum of the values in the data set by the number of values in the data set. It’s given that data set A consists of the heights of \(75\) objects and has a mean of \(25\) meters. This can be represented by the equation \(x/75 = 25\), where \(x\) represents the sum of the heights of the objects, in meters, in data set A. Multiplying both sides of this equation by \(75\) yields \(x = 75(25)\), or \(x = 1,875\) meters. Therefore, the sum of the heights of the objects in data set A is \(1,875\) meters. It’s also given that data set B consists of the heights of \(50\) objects and has a mean of \(65\) meters. This can be represented by the equation \(y/50 = 65\), where \(y\) represents the sum of the heights of the objects, in meters, in data set B. Multiplying both sides of this equation by \(50\) yields \(y = 50(65)\), or \(y = 3,250\) meters. Therefore, the sum of the heights of the objects in data set B is \(3,250\) meters. Since it’s given that data set C consists of the heights of the \(125\) objects from data sets A and B, it follows that the mean of data set C is the sum of the heights of the objects, in meters, in data sets A and B divided by the number of objects represented in data sets A and B, or \(1,875 + 3,250/125\), which is equivalent to \(41\) meters. Therefore, the mean, in meters, of data set C is \(41\).
  15. Question 15

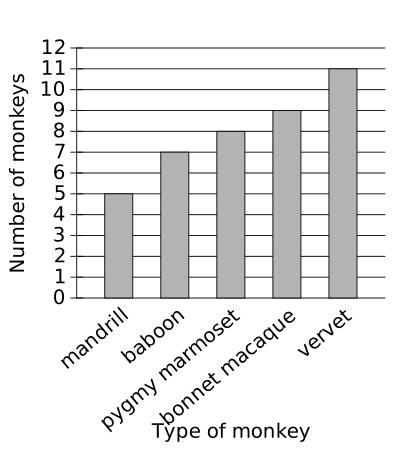
    The bar graph shows the number of each type of monkey in a sanctuary. 1211109876543210Number of monkeysmandrillbaboonpygmy marmosetbonnet macaquevervet Type of monkey The Number of monkeys data for the 5 bars are as follows: mandrill: 5 baboon: 7 pygmy marmoset: 8 bonnet macaque: 9 vervet: 11 How many more vervets are in this sanctuary than mandrills?

    Correct answer: B

    Choice B is correct. It's given that the bar graph shows the number of each type of monkey in a sanctuary. The bar representing the number of mandrills has a height of \(5\); therefore, there are \(5\) mandrills in the sanctuary. The bar representing vervets has a height of \(11\); therefore, there are \(11\) vervets in the sanctuary. Therefore, there are \(11 -5\), or \(6\), more vervets in this sanctuary than mandrills. Choice A is incorrect. This is the number of vervets in the sanctuary. Choice C is incorrect. This is the number of mandrills in the sanctuary. Choice D is incorrect and may result from conceptual or calculation errors.
  16. Question 16

    The table above shows the land area, in square kilometers, of the five smallest countries of the world in 2016. Based on the table, what is the mean land area of the 5 smallest countries in 2016, to the nearest square kilometer?

    Correct answer: B

    Choice B is correct. The mean land area of these 5 countries is equal to the sum of the land areas of these countries, or, divided by the number of countries in the table, 5, or . Combining like terms in the numerator yields, which simplifies to 22.088 square kilometers. This value, when rounded to the nearest square kilometer, is 22.Choice A is incorrect and may result from a calculation error. Choice C is incorrect. This is the greatest land area of the 5 countries in the table. Choice D is incorrect. This is the sum of the land areas of the 5 countries in the table, rounded to the nearest square kilometer.
  17. Question 17

    If a is the mean and b is the median of nine consecutive integers, what is the value of ?

    Correct answer: A

    The correct answer is 0. Any nine consecutive integers can be written as,,,,,,,, . The mean of the integers is their sum divided by 9:, which simplifies to . So . Since there is an odd number of integers (nine), the median is the integer in the middle when all the integers are ordered from least to greatest: . So . Therefore,, which is 0.
  18. Question 18

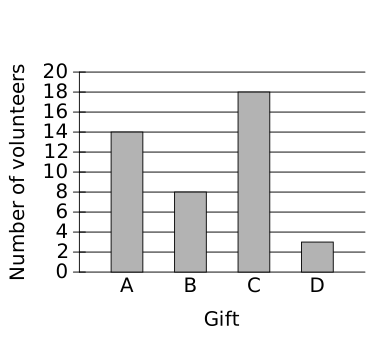
    20181614121086420Number of volunteersABCD Gift The Number of volunteers data for the 4 bars are as follows: A: 14 B: 8 C: 18 D: 3 In April, there were \(43\) volunteers in a cleanup project. Each volunteer was asked to choose a small gift labeled A, B, C, or D. The bar graph shows the number of volunteers who chose each gift. How many volunteers chose gift C?

    Correct answer: D

    Choice D is correct. The height of each bar in the graph shown represents the number of volunteers who chose the gift labeled with the letter specified at the bottom of the bar. The bar for gift C has a height of \(18\). Therefore, \(18\) volunteers chose gift C. Choice A is incorrect. This is the number of volunteers who chose gift D, not gift C. Choice B is incorrect. This is the number of volunteers who chose gift B, not gift C. Choice C is incorrect. This is the number of volunteers who chose gift A, not gift C.
  19. Question 19

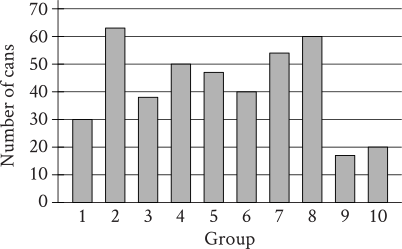
    The data for the 10 categories are as follows: Group 1: 30 Group 2: 63 Group 3: 38 Group 4: 50 Group 5: 47 Group 6: 40 Group 7: 54 Group 8: 60 Group 9: 17 Group 10: 20 The bar graph shows the distribution of \(419\) cans collected by \(10\) different groups for a food drive. How many cans were collected by group \(6\)?

    Correct answer: D

    The correct answer is \(40\). The height of each bar in the bar graph shown represents the number of cans collected by the group specified at the bottom of the bar. The bar for group \(6\) reaches a height of \(40\). Therefore, group \(6\) collected \(40\) cans.
  20. Question 20

    Data set X: \(5\), \(9\), \(9\), \(13\) Data set Y: \(5\), \(9\), \(9\), \(13\), \(27\) The lists give the values in data sets X and Y. Which statement correctly compares the mean of data set X and the mean of data set Y?

    Correct answer: B

    Choice B is correct. ​​The mean of a data set is the sum of the values in the data set divided by the number of values in the data set. It follows that the mean of data set X is \(5 + 9 + 9 + 13/4\), or \(9\), and the mean of data set Y is \(5 + 9 + 9 + 13 + 27/5\), or \(12.6\). Since \(9\) is less than \(12.6\), the mean of data set X is less than the mean of data set Y. Alternate approach: Data set Y consists of the \(4\) values in data set X and one additional value, \(27\). Since the additional value, \(27\), is larger than any value in data set X, the mean of data set X is less than the mean of data set Y. Choice A is incorrect and may result from conceptual or calculation errors. Choice C is incorrect and may result from conceptual or calculation errors. Choice D is incorrect and may result from conceptual or calculation errors.
  21. Question 21

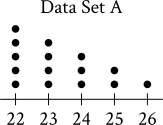
    The data for the dot plot are as follows: 22: 5 dots 23: 4 dots 24: 3 dots 25: 2 dots 26: 1 dot The dot plot represents the \(15\) values in data set A. Data set B is created by adding \(56\) to each of the values in data set A. Which of the following correctly compares the medians and the ranges of data sets A and B?

    Correct answer: C

    Choice C is correct. The median of a data set with an odd number of values, in ascending or descending order, is the middle value of the data set, and the range of a data set is the positive difference between the maximum and minimum values in the data set. Since the dot plot shown gives the values in data set A in ascending order and there are \(15\) values in the data set, the eighth value in data set A, \(23\), is the median. The maximum value in data set A is \(26\) and the minimum value is \(22\), so the range of data set A is \(26 -22\), or \(4\). It’s given that data set B is created by adding \(56\) to each of the values in data set A. Increasing each of the \(15\) values in data set A by \(56\) will also increase its median value by \(56\) making the median of data set B \(79\). Increasing each value of data set A by \(56\) does not change the range, since the maximum value of data set B is \(26 + 56\), or \(82\), and the minimum value is \(22 + 56\), or \(78\), making the range of data set B \(82 -78\), or \(4\). Therefore, the median of data set B is greater than the median of data set A, and the range of data set B is equal to the range of data set A. Choice A is incorrect and may result from conceptual or calculation errors. Choice B is incorrect and may result from conceptual or calculation errors. Choice D is incorrect and may result from conceptual or calculation errors.
  22. Question 22

    Response Frequency Once a week or more \(3\) Two or three times a month \(16\) About once a month \(26\) A few times a year \(73\) Almost never \(53\) Never \(29\) Total \(200\) The table gives the results of a survey of \(200\) people who were asked how often they see a movie in a theater. How many people responded either “never” or “almost never”?

    Correct answer: C

    Choice C is correct. The table gives the results of \(200\) people who were asked how often they see a movie in a theater. The table shows that \(29\) people responded “never” and \(53\) people responded “almost never.” Therefore, \(29 + 53\), or \(82\), people responded either “never” or “almost never.” Choice A is incorrect. This is the difference between the number of people who responded “almost never” and the number of people who responded “never.” Choice B is incorrect. This is the number of people who responded “almost never” but doesn't include those who responded “never.” Choice D is incorrect. This is the number of people who responded something other than “never” or “almost never,” rather than the number of people who responded either “never” or “almost never.”
  23. Question 23

    Which of the following statements about the means and medians of data set A and data set B is true?

    Correct answer: A

    Choice A is correct. The mean of a data set is the sum of the values divided by the number of values. The mean of data set A is, or 5. The mean of data set B is, or 14.5. Thus, the means are different. The median of a data set is the middle value when the values are ordered from least to greatest. The medians of data sets A and B are both 5. Therefore, the medians are the same, so only the means are different.Choices B, C, and D are incorrect and may result from conceptual or calculation errors.
  24. Question 24

    \(71\), \(72\), \(73\), \(76\), \(77\), \(79\), \(83\), \(87\), \(93\) What is the median of the data shown?

    Correct answer: B

    Choice B is correct. The median of a data set with an odd number of data values is defined as the middle value of the ordered list of values. The data set shown has nine values, so the median is the fifth value in the ordered list, which is \(77\). Choice A is incorrect. This is the minimum value of the data set, not the median. Choice C is incorrect and may result from conceptual or calculation errors. Choice D is incorrect. This is the mean of the data set, not the median.
  25. Question 25

    The weights, in pounds, for 15 horses in a stable were reported, and the mean, median, range, and standard deviation for the data were found. The horse with the lowest reported weight was found to actually weigh 10 pounds less than its reported weight. What value remains unchanged if the four values are reported using the corrected weight?

    Correct answer: B

    Choice B is correct. The median weight is found by ordering the horses’ weights from least to greatest and then determining the middle value from this list of weights. Decreasing the value for the horse with the lowest weight doesn’t affect the median since it’s still the lowest value.Choice A is incorrect. The mean is calculated by finding the sum of all the weights of the horses and then dividing by the number of horses. Decreasing one of the weights would decrease the sum and therefore decrease the mean. Choice C is incorrect. Range is the difference between the highest and lowest weights, so decreasing the lowest weight would increase the range. Choice D is incorrect. Standard deviation is calculated based on the mean weight of the horses. Decreasing one of the weights decreases the mean and therefore would affect the standard deviation.
  26. Question 26

    What is the range of the number of wheels made for the 11 one-hour periods?

    Correct answer: B

    Choice B is correct. Range is defined as the difference between the greatest and least values from a set of data. The greatest number of wheels made during a one-hour period was 24 wheels. The least number of wheels was 19. Hence, the range is, or 5.0.Choices A, C, and D are incorrect and may be the result of arithmetic errors or incorrectly identifying the greatest or least number of wheels made during a one-hour period.
  27. Question 27

    The mean amount of time that the 20 employees of a construction company have worked for the company is 6.7 years. After one of the employees leaves the company, the mean amount of time that the remaining employees have worked for the company is reduced to 6.25 years. How many years did the employee who left the company work for the company?

    Correct answer: D

    Choice D is correct. The mean amount of time that the 20 employees worked for the company is 6.7 years. This means that the total number of years all 20 employees worked for the company is (6.7)(20) = 134 years. After the employee left, the mean amount of time that the remaining 19 employees worked for the company is 6.25 years. Therefore, the total number of years all 19 employees worked for the company is (6.25)(19) = 118.75 years. It follows that the number of years that the employee who left had worked for the company is 134 – 118.75 = 15.25 years.Choice A is incorrect; this is the change in the mean, which isn’t the same as the amount of time worked by the employee who left. Choice B is incorrect and likely results from making the assumption that there were still 20 employees, rather than 19, at the company after the employee left and then subtracting the original mean of 6.7 from that result. Choice C is incorrect and likely results from making the assumption that there were still 20 employees, rather than 19, at the company after the employee left.
  28. Question 28

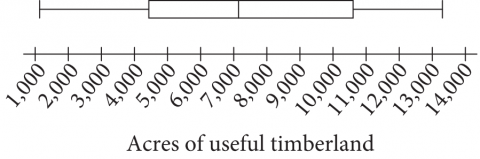
    The number of acres of useful timberland in 13 counties in California is summarized in the box plot above. Which of the following is closest to the median number of acres?

    Correct answer: B

    Choice B is correct. The median of the data summarized by a box plot is the value associated with the vertical line segment within the box. According to the box plot shown, this value is slightly greater than 7,000. Therefore, the closest value for the median number of acres is 7,067.Choice A is incorrect. This is the value associated with the vertical line segment forming the left-hand side of the box. Choice C is incorrect. This value is greater than the value associated with the vertical line segment within the box. Choice D is incorrect. This is the value associated with the vertical line segment forming the right-hand side of the box.
  29. Question 29

    Each value in the data set shown represents the height, in centimeters, of a plant. \(6\), \(10\), \(13\), \(2\), \(15\), \(22\), \(10\), \(4\), \(4\), \(4\) What is the mean height, in centimeters, of these plants?

    Correct answer: B

    The correct answer is \(9\). The mean of a data set is the sum of the values in the data set divided by the number of values in the data set. It follows that the mean height, in centimeters, of these plants is the sum of the heights, in centimeters, of each plant, \(6 + 10 + 13 + 2 + 15 + 22 + 10 + 4 + 4 + 4\), or \(90\), divided by the number of plants in the data set, \(10\). Therefore, the mean height, in centimeters, of these plants is \(90/10\), or \(9\).
  30. Question 30

    \(23\), \(27\), \(27\), \(32\), \(35\), \(36\), \(52\) What is the range of the \(7\) scores shown?

    Correct answer: C

    The correct answer is \(29\). The range of a data set is the difference between its maximum value and its minimum value. For the data set shown, the maximum score is \(52\) and the minimum score is \(23\). The difference between those scores is \(52 -23\), or \(29\). Therefore, the range of the \(7\) scores shown is \(29\).
  31. Question 31

    Each of the following frequency tables represents a data set. Which data set has the greatest mean?

    Correct answer: A

    Choice A is correct. The tables in choices B, C, and D each represent a data set where the values \(80\) and \(90\) have the same frequency and the values \(70\) and \(100\) have the same frequency. It follows that each of these data sets is symmetric around the value halfway between \(80\) and \(90\), or \(85\). When a data set is symmetric around a value, that value is the mean of the data set. Therefore, the data sets represented by the tables in choices B, C, and D each have a mean of \(85\). The table in choice A represents a data set where the value \(90\) has a greater frequency than the value \(80\) and the value \(100\) has a greater frequency than the value \(70\). It follows that this data set has a mean greater than \(85\). Therefore, of the given choices, choice A represents the data set with the greatest mean. Choice B is incorrect and may result from conceptual or calculation errors. Choice C is incorrect and may result from conceptual or calculation errors. Choice D is incorrect and may result from conceptual or calculation errors.
  32. Question 32

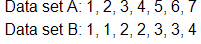
    Which of the following statements correctly compares the means of data set A and data set B?

    Correct answer: D

    Choice D is correct. The mean of a data set is found by dividing the sum of the values in the data set by the number of values in the data set. Therefore, the mean of data set A is, or 4. The mean of data set B is, or approximately 2.2857. Therefore, the mean of data set A is greater than the mean of data set B.Alternate approach: Data set A and data set B are both ordered from least to greatest value. Besides the first value in each data set, which is 1, each value in ordered data set B is less than the respective value in ordered data set A. Therefore, conceptually, the mean of data set A must be greater than the mean of data set B.Choices A, B, and C are incorrect and may result from various misconceptions or miscalculations.
  33. Question 33

    What was the mean low temperature, in °s Fahrenheit, during the five-day period?

    Correct answer: A

    Choice A is correct. The mean low temperature can be calculated by finding the sum of the low temperatures for all the days shown in the table, 49 + 37 + 41 + 54 + 63 = 244, and then dividing the sum by the number of days the temperature was recorded, .Choice B is incorrect. This may be the result of choosing the median rather than calculating the mean. Choices C and D are incorrect and may be the result of calculation errors.
  34. Question 34

    \(6\), \(6\), \(8\), \(8\), \(8\), \(10\), \(21\) Which of the following lists represents a data set that has the same median as the data set shown?

    Correct answer: B

    Choice B is correct. If a data set contains an odd number of data values, the median is represented by the middle data value in the list when the data values are listed in ascending or descending order. Since the data set shown has \(7\) data values and is in ascending order, it follows that the median is the fourth data value in the list, or \(8\). If a data set contains an even number of data values, the median is between the two middle data values when the values are listed in ascending or descending order. Since each of the choices consists of a data set with \(6\) data values in ascending order, it follows that the median is between the third and fourth data value. The third and fourth data values in choice B are \(8\) and \(8\). Thus, choice B represents a data set with a median of \(8\). Since the median of the data set shown is \(8\) and choice B represents a data set with a median of \(8\), it follows that choice B represents a data set that has the same median as the data set shown. Choice A is incorrect. This list represents a data set with a median of \(6\), not \(8\). Choice C is incorrect. This list represents a data set with a median of \(10\), not \(8\). Choice D is incorrect. This list represents a data set with a median of \(10\), not \(8\).
  35. Question 35

    A list of \(10\) data values is shown. \(6\), \(8\), \(16\), \(4\), \(17\), \(26\), \(8\), \(5\), \(5\), \(5\) What is the mean of these data?

    Correct answer: A

    The correct answer is \(10\). The mean of a data set is calculated by dividing the sum of the data values by the number of data values in the data set. For this data set, the mean can be calculated as \(6 + 8 + 16 + 4 + 17 + 26 + 8 + 5 + 5 + 5/10\), which is equivalent to \(100/10\), or \(10\).
  36. Question 36

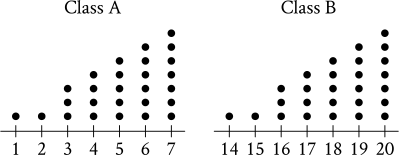
    For the dot plot titled Class A: The number line ranges from 1 to 7 in increments of 1. The data for the dot plot are as follows: 1: 1 dot 2: 1 dot 3: 3 dots 4: 4 dots 5: 5 dots 6: 6 dots 7: 7 dots For the dot plot titled Class B: The number line ranges from 14 to 20 in increments of 1. The data for the dot plot are as follows: 14: 1 dot 15: 1 dot 16: 3 dots 17: 4 dots 18: 5 dots 19: 6 dots 20: 7 dots Each of the dot plots shown represents the number of glue sticks brought in by each student for two classes, class A and class B. Which statement best compares the standard deviations of the numbers of glue sticks brought in by each student for these two classes?

    Correct answer: B

    Choice B is correct. Standard deviation is a measure of the spread of a data set from its mean. The dot plot for class A and the dot plot for class B have the same shape. Thus, the frequency distributions for both class A and class B are the same. Since both class A and class B have the same frequency distribution of glue sticks brought in by each student, it follows that both class A and class B have the same spread of the number of glue sticks brought in by each student from their respective means. Therefore, the standard deviation of the number of glue sticks brought in by each student for class A is equal to the standard deviation of the number of glue sticks brought in by each student for class B. Choice A is incorrect and may result from conceptual or calculation errors. Choice C is incorrect and may result from conceptual or calculation errors. Choice D is incorrect and may result from conceptual or calculation errors.
  37. Question 37

    The table shows the frequency of values in a data set. Value Frequency \(19\) \(7\) \(21\) \(1\) \(23\) \(7\) \(25\) \(4\) What is the minimum value of the data set?

    Correct answer: B

    The correct answer is \(19\). The minimum value of a data set is the least value in the data set. The frequency refers to the number of times a value occurs. The given table shows that for this data set, the value \(19\) occurs \(7\) times, the value \(21\) occurs \(1\) time, the value \(23\) occurs \(7\) times, and the value \(25\) occurs \(4\) times. Therefore, of the values \(19\), \(21\), \(23\), and \(25\) given in the data set, the minimum value of the data set is \(19\).
  38. Question 38

    For which of the following data sets is the mean greater than the median? Note: If you are manually calculating the mean for each answer, you are doing it wrong. You need to be time efficient on the SAT. Think in terms of "what would make the mean of a dataset incresase significantly"?

    Correct answer: C

    Choice C is correct. If the values in a data set are ordered from least to greatest, the median of the data set will be the middle value. Since each data set in the choices is ordered and contains exactly 9 data values, the 5th value in each is the median. It follows that the median of the data set in choice C is 32. The sum of the positive differences between 32 and each of the values that are less than 32 is significantly smaller than the sum of the positive differences between 32 and each of the values that are greater than 32. If 32 were the mean, these sums would have been equal to each other. Therefore, the mean of this data set must be greater than 32. This can also be confirmed by calculating the mean as the sum of the values divided by the number of values in the data set: .Choices A and B are incorrect. Each of the data sets in these choices is symmetric with respect to its median, so the mean and the median for each of these choices are equivalent. Choice D is incorrect. The median of this data set is 207. Since the sum of the positive differences between 207 and each of the values less than 207 is greater than the sum of the positive differences between 207 and each value greater than 207 in this data set, the mean must be less than the median.
  39. Question 39

    In the table above, Melissa recorded the price of one gallon of regular gas from five different local gas stations on the same day. What is the median of the gas prices Melissa recorded?

    Correct answer: C

    Choice C is correct. The median of a data set is the middle value when the data is in ascending or descending order. In ascending order, the gas prices are $3.609, $3.679, $3.699, $3.729, and $3.729. The middle number of this list is 3.699, so it follows that $3.699 is the median gas price.Choice A is incorrect. When the gas prices are listed in ascending order, this value isn’t the middle number. Choice B is incorrect. This value represents the mean gas price. Choice D is incorrect. This value represents both the mode and the maximum gas price.
  40. Question 40

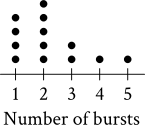
    The data for the dot plot are as follows: 1: 4 dots 2: 5 dots 3: 2 dots 4: 1 dot 5: 1 dot The dot plot represents a data set of the number of bursts for \(13\) eruptions of a steam vent. If an additional eruption with \(11\) bursts is added to this data set to create a new data set of \(14\) eruptions, which of the following measures will be greater for the new data set than for the original data set? The median number of bursts The mean number of bursts

    Correct answer: C

    Choice C is correct. It’s given that the dot plot represents a data set of the number of bursts for \(13\) eruptions of a steam vent. The median of a data set with an odd number of elements is the middle element when the elements are in numerical order. For \(13\) elements in numerical order, this is the \(7th\) element. For this data set, the first \(4\) elements have a value of \(1\), and the next \(5\) elements have a value of \(2\). Thus, the \(7th\) element in the ordered data set is \(2\) and the median number of bursts for the original data set is \(2\). If an additional eruption with \(11\) bursts is added to this data set to create a new data set of \(14\) eruptions, the median of the new data set will be between the \(7th\) and \(8th\) elements in the ordered set, which will also be \(2\). Therefore, the median number of bursts for the new data set will be the same as the median number of bursts for the original data set. The mean number of bursts for the original data set is found by adding the values of all \(13\) elements and dividing that sum by the number of elements, \(13\). Since the data is shown in a dot plot, the sum of the values of the elements can be found by multiplying each element's value by its frequency: \(1(4)+ 2(5)+ 3(2)+ 4(1)+ 5(1)\), or \(29\). Therefore, the mean number of bursts for the original data set is \(29/13\). If an additional eruption with \(11\) bursts is added to this data set to create a new data set of \(14\) bursts, the mean number of bursts for the new data set is \(29 + 11/14\), or \(40/14\). Since \(40/14 > 29/13\), the mean number of bursts for the new data set is greater than the mean number of bursts for the original data set. Therefore, of the median number of bursts and the mean number of bursts, only the mean number of bursts is greater for the new data set than for the original data set. Choice A is incorrect and may result from conceptual or calculation errors. Choice B is incorrect and may result from conceptual or calculation errors. Choice D is incorrect and may result from conceptual or calculation errors.
  41. Question 41

    Type of store Average number of employees Warehouse store \(365\) Department store \(213\) Supermarket \(130\) For a certain region, the table shows the average number of store employees in \(2016\) by type of store. Based on the table, how much greater was the average number of store employees in warehouse stores than in supermarkets?

    Correct answer: C

    Choice C is correct. The table shows that for a certain region in \(2016\), the average number of store employees in warehouse stores was \(365\) and the average number of store employees in supermarkets was \(130\). Subtracting \(130\) from \(365\) yields \(365 -130\), or \(235\). Therefore, the average number of store employees was \(235\) greater in warehouse stores than in supermarkets. Choice A is incorrect. For this region in \(2016\), this is how much greater the average number of store employees was in department stores than in supermarkets. Choice B is incorrect. For this region in \(2016\), this is how much greater the average number of store employees was in warehouse stores than in department stores. Choice D is incorrect. For this region in \(2016\), this is the sum of the average number of store employees in warehouse stores and in supermarkets.
  42. Question 42

    The list gives the mass, in grams, of \(5\) alπne marmots. \(4,010\); \(4,010\); \(3,030\); \(4,050\); \(3,050\) What is the mean mass, in grams, of these \(5\) alπne marmots?

    Correct answer: A

    The correct answer is \(3,630\). The mean of a data set is the sum of the values in the data set divided by the number of values in the data set. The sum of the masses, in grams, of these alπne marmots is \(4,010 + 4,010 + 3,030 + 4,050 + 3,050\), or \(18,150\) grams. The number of alπne marmots in the data set is \(5\). Therefore, the mean mass, in grams, of these \(5\) alπne marmots is \(18,150/5\), or \(3,630\).
  43. Question 43

    The mean score of 8 players in a basketball game was 14.5 points. If the highest individual score is removed, the mean score of the remaining 7 players becomes 12 points. What was the highest score?

    Correct answer: C

    Choice C is correct. If the mean score of 8 players is 14.5, then the total of all 8 scores is . If the mean of 7 scores is 12, then the total of all 7 scores is . Since the set of 7 scores was made by removing the highest score of the set of 8 scores, then the difference between the total of all 8 scores and the total of all 7 scores is equal to the removed score: .Choice A is incorrect because if 20 is removed from the group of 8 scores, then the mean score of the remaining 7 players is is approximately 13.71, not 12. Choice B is incorrect because if 24 is removed from the group of 8 scores, then the mean score of the remaining 7 players is is approximately 13.14, not 12. Choice D is incorrect because if 36 is removed from the group of 8 scores, then the mean score of the remaining 7 players is or approximately 11.43, not 12.
  44. Question 44

    Which of the following MUST be true? Every member of team A completed the race in less time than any member of team B. The median time it took the members of team B to complete the race is greater than the median time it took the members of team A to complete the race. There is at least one member of team B who took more time to complete the race than some member of team A.

    Correct answer: A

    Choice A is correct. Since the average time for the 10 members of team A is 3.41 minutes, the sum of the 10 times for team A is equal to minutes. Since the average time for the 10 members of team B is 3.79 minutes, the sum of the 10 times for team B is equal to minutes. Since the sum of the 10 times for team B is greater than the sum of the 10 times for team A, it must be true that at least one of the times for team B must be greater than one of the times for team A. Thus, statement III is true. However, it’s possible that at least some of the times for team A were greater than some of the times for team B. For example, all of team A’s times could be 3.41 minutes, and team B could have 1 time of 3.34 minutes and 9 times of 3.84 minutes. Thus, statement I need not be true. It’s also possible that the median of the times for team B is less than the median of the times for team A. For example, all of team A’s times could be 3.41 minutes, and team B could have 6 times of 3.37 minutes and 4 times of 4.42 minutes; then the median of team B’s times would be 3.37 minutes and the median of team A’s times would be 3.41 minutes. Thus, statement II need not be true.Choices B, C, and D are incorrect because neither statement I nor statement II must be true.
  45. Question 45

    The frequency distribution above summarizes a set of data, where a is a positive integer. How much greater is the mean of the set of data than the median?

    Correct answer: A

    Choice A is correct. Since the frequencies of values less than the middle value, 3, are the same as the frequencies of the values greater than 3, the set of data has a symmetric distribution. When a set of data has a symmetric distribution, the mean and median values are equal. Therefore, the mean is 0 greater than the median.Choices B, C, and D are incorrect and may result from misinterpreting the set of data.
  46. Question 46

    \(2\), \(9\), \(14\), \(23\), \(32\) What is the mean of the data shown?

    Correct answer: B

    Choice B is correct. The mean of a set of data values is the sum of all the data values divided by the number of data values in the set. The sum of the data values shown is \(2 + 9 + 14 + 23 + 32\), or \(80\). Since there are \(5\) data values in the set, the mean of the data shown is \(80/5\), or \(16\). Choice A is incorrect. This is the median, not the mean, of the data shown. Choice C is incorrect and may result from conceptual or calculation errors. Choice D is incorrect. This is the maximum, not the mean, of the data shown.
  47. Question 47

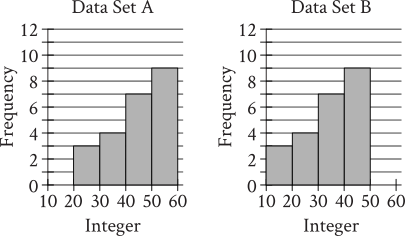
    Data Set A: The horizontal axis is labeled Integer. It ranges from 10 to 60 and is divided into 5 equal intervals. The vertical axis is labeled Frequency. It ranges from 0 to 12 in increments of 1, with values marked every 2 grid lines. The histogram has a skewed right shape. The histogram has 4 bins. The Frequency data for the 4 bins are as follows: 20 to 30: 3 30 to 40: 4 40 to 50: 7 50 to 60: 9 Data Set B: The horizontal axis is labeled Integer. It ranges from 10 to 60 and is divided into 5 equal intervals. The vertical axis is labeled Frequency. It ranges from 0 to 12 in increments of 1, with values marked every 2 grid lines. The histogram has a skewed right shape. The histogram has 4 bins. The Frequency data for the 4 bins are as follows: 10 to 20: 3 20 to 30: 4 30 to 40: 7 40 to 50: 9 Two data sets of \(23\) integers each are summarized in the histograms shown. For each of the histograms, the first interval represents the frequency of integers greater than or equal to \(10\), but less than \(20\). The second interval represents the frequency of integers greater than or equal to \(20\), but less than \(30\), and so on. What is the smallest possible difference between the mean of data set A and the mean of data set B?

    Correct answer: B

    Choice B is correct. The histograms shown have the same shape, but data set A contains values between \(20\) and \(60\) and data set B contains values between \(10\) and \(50\). Thus, the mean of data set A is greater than the mean of data set B. Therefore, the smallest possible difference between the mean of data set A and the mean of data set B is the difference between the smallest possible mean of data set A and the greatest possible mean of data set B. In data set A, since there are \(3\) integers in the interval greater than or equal to \(20\) but less than \(30\), \(4\) integers greater than or equal to \(30\) but less than \(40\), \(7\) integers greater than or equal to \(40\) but less than \(50\), and \(9\) integers greater than or equal to \(50\) but less than \(60\), the smallest possible mean for data set A is \((3 dot 20)+(4 dot 30)+(7 dot 40)+(9 dot 50)/23\). In data set B, since there are \(3\) integers greater than or equal to \(10\) but less than \(20\), \(4\) integers greater than or equal to \(20\) but less than \(30\), \(7\) integers greater than or equal to \(30\) but less than \(40\), and \(9\) integers greater than or equal to \(40\) but less than \(50\), the largest possible mean for data set B is \((3 dot 19)+(4 dot 29)+(7 dot 39)+(9 dot 49)/23\). Therefore, the smallest possible difference between the mean of data set A and the mean of data set B is \((3 dot 20)+(4 dot 30)+(7 dot 40)+(9 dot 50)/23 -(3 dot 19)+(4 dot 29)+(7 dot 39)+(9 dot 49)/23\), which is equivalent to \((3 dot 20)-(3 dot 19)+(4 dot 30)-(4 dot 29)+(7 dot 40)-(7 dot 39)+(9 dot 50)-(9 dot 49)/23\). This expression can be rewritten as \(3(20 -19)+ 4(30 -29)+ 7(40 -39)+ 9(50 -49)/23\), or \(23/23\), which is equal to \(1\). Therefore, the smallest possible difference between the mean of data set A and the mean of data set B is \(1\). Choice A is incorrect. This is the smallest possible difference between the ranges, not the means, of the data sets. Choice C is incorrect. This is the difference between the greatest possible mean, not the smallest possible mean, of data set A and the greatest possible mean of data set B. Choice D is incorrect. This is the smallest possible difference between the sum of the values in data set A and the sum of the values in data set B, not the smallest possible difference between the means.
  48. Question 48

    The table shown summarizes the number of employees at each of the \(17\) restaurants in a town. Number of employees Number of restaurants \(2\) to \(7\) \(2\) \(8\) to \(13\) \(4\) \(14\) to \(19\) \(2\) \(20\) to \(25\) \(7\) \(26\) to \(31\) \(2\) Which of the following could be the median number of employees for the restaurants in this town?

    Correct answer: D

    Choice D is correct. If a data set contains an odd number of data values, the median is represented by the middle data value in the list when the data values are listed in ascending or descending order. Since the numbers of employees are given as ranges of values rather than specific values, it's only possible to determine the range in which the median falls, rather than the exact median. Since there are \(17\) restaurants included in the data set and the numbers of employees are listed in ascending order, it follows that the median number of employees will be represented by the ninth restaurant in the list. Since the first \(2\) restaurants each have \(2\) to \(7\) employees, numbers of employees in the \(2\) to \(7\) range would be represented by the first and second restaurants in the list. The next \(4\) restaurants each have \(8\) to \(13\) employees. Therefore, numbers of employees in the \(8\) to \(13\) range will be represented by the third through sixth restaurants in the list. The next \(2\) restaurants each have \(14\) to \(19\) employees. Therefore, numbers of employees in the \(14\) to \(19\) range will be represented by the seventh and eighth restaurants in the list. Since the next \(7\) restaurants each have \(20\) to \(25\) employees, numbers of employees in the \(20\) to \(25\) range will be represented by the ninth through fifteenth restaurants in the list. This means that the ninth restaurant in the list, which has the median number of employees for the restaurants in this town, has a number of employees in the \(20\) to \(25\) range. Of the given choices, the only number of employees in the \(20\) to \(25\) range is \(21\). Choice A is incorrect and may result from conceptual or calculation errors. Choice B is incorrect. This is the position of the median in the list, not the value of the median. Choice C is incorrect and may result from conceptual or calculation errors.
  49. Question 49

    Weight (pounds) Frequency \(13\) \(12\) \(14\) \(8\) \(15\) \(5\) \(16\) \(7\) \(17\) \(9\) \(18\) \(10\) \(19\) \(13\) \(20\) \(7\) The frequency table summarizes a data set of the weights, rounded to the nearest pound, of \(71\) tortoises. A weight of \(39\) pounds is added to the original data set, creating a new data set of the weights, rounded to the nearest pound, of \(72\) tortoises. Which statement best compares the mean and median of the new data set to the mean and median of the original data set?

    Correct answer: B

    Choice B is correct. The mean of a data set is the sum of the values in the data set divided by the number of values in the data set. The new data set consists of the weights of the \(71\) tortoises in the original data set and one additional weight, \(39\). Since the additional weight, \(39\), is greater than any of the values in the original data set, the mean of the new data set is greater than the mean of the original data set. If a data set contains an odd number of data values, the median is represented by the middle data value in the list when the data values are listed in ascending or descending order. Since the original data set consists of the weights of \(71\) tortoises and is in ascending order, the median of the original data set is represented by the middle value, or the \(36th\) value. Based on the frequencies shown in the table, the \(36th\) value in this data set is \(17\). If a data set contains an even number of data values, the median is between the two middle data values when the values are listed in ascending or descending order. Since the new data set consists of the weights of \(72\) tortoises, the median of the new data set is between the \(36th\) and \(37th\) data values when the values are arranged in ascending order. To keep the data in ascending order, the additional value of \(39\) would be placed at the bottom of the frequency table with a frequency of \(1\). Therefore, based on the frequencies in the table, the \(36th\) and \(37th\) values in the new data set are both \(17\). It follows that the median of the new data set is \(17\), which is the same as the median of the original data set. Therefore, the mean of the new data set is greater than the mean of the original data set, and the medians of the two data sets are equal. Choice A is incorrect and may result from conceptual or calculation errors. Choice C is incorrect and may result from conceptual or calculation errors. Choice D is incorrect and may result from conceptual or calculation errors.
  50. Question 50

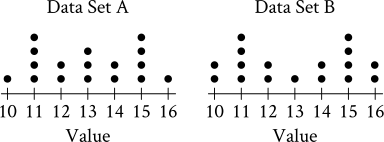
    The dot plots represent the distributions of values in data sets A and B. For the dot plot titled Data Set A: The number line ranges from 10 to 16 in increments of 1. The data for the dot plot are as follows: 10: 1 dot 11: 4 dots 12: 2 dots 13: 3 dots 14: 2 dots 15: 4 dots 16: 1 dot For the dot plot titled Data Set B: The number line ranges from 10 to 16 in increments of 1. The data for the dot plot are as follows: 10: 2 dots 11: 4 dots 12: 2 dots 13: 1 dot 14: 2 dots 15: 4 dots 16: 2 dots Which of the following statements must be true? The median of data set A is equal to the median of data set B. The standard deviation of data set A is equal to the standard deviation of data set B.

    Correct answer: A

    Choice A is correct. The median of a data set with an odd number of values that are in ascending or descending order is the middle value of the data set. Since the distribution of the values of both data set A and data set B form symmetric dot plots, and each data set has an odd number of values, it follows that the median is given by the middle value in each of the dot plots. Thus, the median of data set A is \(13\), and the median of data set B is \(13\). Therefore, statement I is true. Data set A and data set B have the same frequency for each of the values \(11\), \(12\), \(14\), and \(15\). Data set A has a frequency of \(1\) for values \(10\) and \(16\), whereas data set B has a frequency of \(2\) for values \(10\) and \(16\). Standard deviation is a measure of the spread of a data set; it is larger when there are more values further from the mean, and smaller when there are more values closer to the mean. Since both distributions are symmetric with an odd number of values, the mean of each data set is equal to its median. Thus, each data set has a mean of \(13\). Since more of the values in data set A are closer to \(13\) than data set B, it follows that data set A has a smaller standard deviation than data set B. Thus, statement II is false. Therefore, only statement I must be true. Choice B is incorrect and may result from conceptual or calculation errors. Choice C is incorrect and may result from conceptual or calculation errors. Choice D is incorrect and may result from conceptual or calculation errors.
  51. Question 51

    International Tourist Arrivals, in millionsCountry20122013France83.084.7United States66.769.8Spain57.560.7China57.755.7Italy46.447.7Turkey35.737.8Germany30.431.5United Kingdom26.332.2Russia24.728.4The table above shows the number of international tourist arrivals, rounded to the nearest tenth of a million, to the top nine tourist destinations in both 2012 and 2013. Based on the information given in the table, how much greater, in millions, was the median number of international tourist arrivals to the top nine tourist destinations in 2013 than the median number in 2012, to the nearest tenth of a million?

    Correct answer: C

    The correct answer is 1.3. The median number of tourists is found by ordering the number of tourists from least to greatest and determining the middle value from this list. When the number of tourists in 2012 is ordered from least to greatest, the middle value, or the fifth number, is 46.4 million. When the number of tourists in 2013 is ordered from least to greatest, the middle value, or the fifth number, is 47.7 million. The difference between these two medians is . Note that 1.3 and 13/10 are examples of ways to enter a correct answer.
  52. Question 52

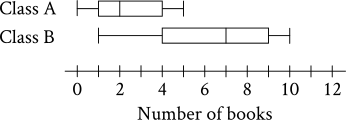
    From left to right, the values of the vertical bars in the Class A box plot are as follows: First vertical bar: 0 Second vertical bar: 1 Third vertical bar: 2 Fourth vertical bar: 4 Fifth vertical bar: 5 From left to right, the values of the vertical bars in the Class B box plot are as follows: First vertical bar: 1 Second vertical bar: 4 Third vertical bar: 7 Fourth vertical bar: 9 Fifth vertical bar: 10 The two box plots show the distribution of number of books read over the summer by the students in two different English classes. What is the positive difference between the ranges of number of books read over the summer for the two classes?

    Correct answer: A

    The correct answer is \(4\). It's given that the two boxplots show the distribution of number of books read over the summer by the students in two different English classes. In a boxplot, the first vertical line represents the minimum value of the data set and the last vertical line represents the maximum value of the data set. The range of a data set is the difference between its maximum value and its minimum value. In class A, the maximum number of books read is \(5\) and the minimum number of books read is \(0\). The difference between those values is \(5 -0\), or \(5\). Therefore, the range of the number of books read in class A is \(5\). In class B, the maximum number of books read is \(10\) and the minimum number of books read is \(1\). The difference between those values is \(10 -1\), or \(9\). Therefore, the range of the number of books read in class B is \(9\). To find the positive difference between the ranges of the number of books read for the two classes, the smaller range must be subtracted from the larger range. Therefore, the positive difference between the ranges of number of books read over the summer for the two classes is \(9 -5\), or \(4\).
  53. Question 53

    \(73\), \(74\), \(75\), \(77\), \(79\), \(82\), \(84\), \(85\), \(91\) What is the median of the data shown?

    Correct answer: A

    The correct answer is \(79\). The median of a data set with an odd number of values is the middle value of the set when the values are ordered from least to greatest. Because the given data set consists of nine values that are ordered from least to greatest, the median is the fifth value in the data set. Therefore, the median of the data shown is \(79\).
  54. Question 54

    Five Eretmochelys imbricata, a type of sea turtle, each have a nest. The table shows an original data set of the number of eggs that each turtle laid in its nest. Nest Number of eggs A \(149\) B \(144\) C \(148\) D \(136\) E \(139\) A sixth nest with \(121\) eggs is added to create a new data set. Which of the following correctly compares the means of the two data sets?

    Correct answer: A

    Choice A is correct. It's given that the table shows an original data set of \(5\) values. It's also given that a sixth value is added to create a new data set. The new data set consists of the \(5\) values in the original data set and one additional value, \(121\). Since the additional value, \(121\), is less than any value in the original data set, the mean of the original data set is greater than the mean of the new data set. Choice B is incorrect and may result from conceptual or calculation errors. Choice C is incorrect and may result from conceptual or calculation errors. Choice D is incorrect and may result from conceptual or calculation errors.
  55. Question 55

    A data set of 27 different numbers has a mean of 33 and a median of 33. A new data set is created by adding 7 to each number in the original data set that is greater than the median and subtracting 7 from each number in the original data set that is less than the median. Which of the following measures does NOT have the same value in both the original and new data sets?

    Correct answer: D

    Choice D is correct. When a data set has an odd number of elements, the median can be found by ordering the values from least to greatest and determining the middle value. Out of the 27 different numbers in this data set, 13 numbers are below the median, one number is exactly 33, and 13 numbers are above the median. When 7 is subtracted from each number below the median and added to each number above the median, the data spread out from the median. Since the median of this data set, 33, is equivalent to the mean of the data set, the data also spread out from the mean. Since standard deviation is a measure of how spread out the data are from the mean, a greater spread from the mean indicates an increased standard deviation.Choice A is incorrect. All the numbers less than the median decrease and all the numbers greater than the median increase, but the median itself doesn’t change. Choices B and C are incorrect. The mean of a data set is found by dividing the sum of the values by the number of values. The net change from subtracting 7 from 13 numbers and adding 7 to 13 numbers is zero. Therefore, neither the mean nor the sum of the numbers changes.
  56. Question 56

    Value Data set A frequency Data set B frequency \(30\) \(2\) \(9\) \(34\) \(4\) \(7\) \(38\) \(5\) \(5\) \(42\) \(7\) \(4\) \(46\) \(9\) \(2\) Data set A and data set B each consist of \(27\) values. The table shows the frequencies of the values for each data set. Which of the following statements best compares the means of the two data sets?

    Correct answer: A

    Choice A is correct. The mean value of a data set is the sum of the values of the data set divided by the number of values in the data set. When a data set is represented in a frequency table, the sum of the values in the data set is the sum of the products of each value and its frequency. For data set A, the sum of products of each value and its frequency is \(30(2)+ 34(4)+ 38(5)+ 42(7)+ 46(9)\), or \(1,094\). It's given that there are \(27\) values in data set A. Therefore, the mean of data set A is \(1,094/27\), or approximately \(40.52\). Similarly, the mean of data B is \(958/27\), or approximately \(35.48\). Therefore, the mean of data set A is greater than the mean of data set B. Choice B is incorrect and may result from conceptual or calculation errors. Choice C is incorrect and may result from conceptual or calculation errors. Choice D is incorrect and may result from conceptual or calculation errors.
  57. Question 57

    Data set A consists of \(10\) positive integers less than \(60\). The list shown gives \(9\) of the integers from data set A. \(43\), \(45\), \(44\), \(43\), \(38\), \(39\), \(40\), \(46\), \(40\) The mean of these \(9\) integers is \(42\). If the mean of data set A is an integer that is greater than \(42\), what is the value of the largest integer from data set A?

    Correct answer: A

    The correct answer is \(52\). The mean of a data set is calculated by dividing the sum of the data values by the number of values. It’s given that data set A consists of \(10\) values, \(9\) of which are shown. Let \(x\) represent the \(10 th\) data value in data set A, which isn’t shown. The mean of data set A can be found using the expression \(43 + 45 + 44 + 43 + 38 + 39 + 40 + 46 + 40 + x/10\), or \(378 + x/10\). It’s given that the mean of the \(9\) values shown is \(42\) and that the mean of all \(10\) numbers is greater than \(42\). Consequently, the \(10 th\) data value, \(x\), is larger than \(42\). It’s also given that the data values in data set A are positive integers less than \(60\). Thus, \(42 < x < 60\). Finally, it’s given that the mean of data set A is an integer. This means that the sum of the \(10\) data values, \(378 + x\), is divisible by \(10\). Thus, \(378 + x\) must have a ones digit of \(0\). It follows that \(x\) must have a ones digit of \(2\). Since \(42 < x < 60\) and \(x\) has a ones digit of \(2\), the only possible value of \(x\) is \(52\). Since \(52\) is larger than any of the integers shown, the largest integer from data set A is \(52\).
  58. Question 58

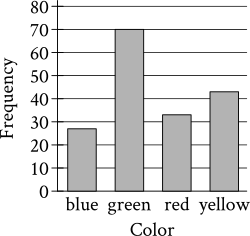
    The Frequency data for the 4 bars are as follows: blue: 27 green: 70 red: 33 yellow: 43 A data set consists of \(173\) colors. The bar graph shows the number of times each color appears in the data set. Which color appears \(70\) times?

    Correct answer: B

    Choice B is correct. It's given that a data set consists of \(173\) colors and the bar graph shows the number of times each color appears in the data set. Therefore, for each color specified at the bottom of the bar, the frequency corresponds to the number of times that color appears in the data set. The color that appears \(70\) times in the data set has a frequency of \(70\) on the bar graph. Since the bar with a frequency of \(70\) corresponds to green, green is the color that appears \(70\) times. Choice A is incorrect. The color blue appears about \(27\) times, not \(70\) times. Choice C is incorrect. The color red appears about \(33\) times, not \(70\) times. Choice D is incorrect. The color yellow appears about \(43\) times, not \(70\) times.
  59. Question 59

    The mean and the median of the five numbers above are equal. Which of the following is NOT a possible value of x ?

    Correct answer: A

    Choice A is correct. If x is 6, then the five numbers in the given list are 15, 14, 18, 17, 6. The mean of these five numbers is the sum of all the values divided by the number of values, or . The median of these five numbers can be found by ordering the numbers from least to greatest and determining the middle value. When ordered from least to greatest, the numbers in the given list are 6, 14, 15, 17, 18, and the middle value is 15. Since the mean is 14 and the median is 15, the mean and median aren’t equal when x is 6.Choices B, C, and D are incorrect. If any of these values is substituted for x, the mean and median of the data set would be equal.
  60. Question 60

    The bar graph shows the distribution of the number of walnuts per container for \(20\) containers at a grocery store. 876543210Frequency75767778Number of walnuts per container The Frequency data for the 4 bars are as follows: 75 walnuts per container: 2 76 walnuts per container: 5 77 walnuts per container: 6 78 walnuts per container: 7 How many of these containers of walnuts contain exactly \(78\) walnuts?

    Correct answer: B

    Choice B is correct. The height of each bar in the graph shown represents the number of containers that contain the number of walnuts specified at the bottom of the bar. The bar for \(78\) walnuts has a height of \(7\). Therefore, \(7\) of these containers of walnuts contain exactly \(78\) walnuts. Choice A is incorrect. This is the number of containers that contain exactly \(75\) walnuts, not \(78\) walnuts. Choice C is incorrect. This is the total number of containers of walnuts represented in the bar graph, not the number that contain exactly \(78\) walnuts. Choice D is incorrect. This is the number of walnuts in a container that contains exactly \(78\) walnuts, not the number of containers that contain exactly \(78\) walnuts.
  61. Question 61

    Which statement is true based on the table?

    Correct answer: C

    Choice C is correct. Standard deviation is a measure of spread, so data sets with larger standard deviations tend to have larger spread. The standard deviation of the heights of the men in Group B is larger than the standard deviation of the heights of the men in Group A. Therefore, the heights of the men in Group B had a larger spread than the heights of the men in Group A.Choice A is incorrect. If two data sets are identical, they will have equivalent means and equivalent standard deviations. Since the two data sets have different standard deviations, they cannot be identical. Choice B is incorrect. Without knowing the maximum value for each data set, it’s impossible to know which group contained the tallest participant. Choice D is incorrect. Since the means of the two groups are equivalent, the medians could also be the same or could be different, but it's impossible to tell from the given information.
  62. Question 62

    For a school fund-raiser, 10 students sold a total of 90 boxes of cookies. Which of the following can be calculated from this information?

    Correct answer: A

    Choice A is correct. The average can be found by dividing the total number of boxes sold by the number of students, which is .Choices B, C, and D are incorrect. Each results from choosing measures that require the results of individual students, which are not given.
  63. Question 63

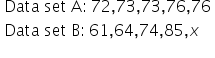
    Data set A and data set B each contain 5 numbers. If the mean of data set A is equal to the mean of data set B, what is the value of x ?

    Correct answer: C

    Choice C is correct. The mean of a data set is found by dividing the sum of the values in the data set by the number of values in the data set. Therefore, the mean of data set A is, which simplifies to 74. The mean of data set B is represented by the equation, or . It’s given that the mean of data set A is equal to the mean of data set B. Therefore, the equation can be used to solve for x. Multiplying both sides of this equation by 5 yields . Subtracting 284 from both sides of this equation yields .Choices A, B, and D are incorrect and may result from calculation errors.
  64. Question 64

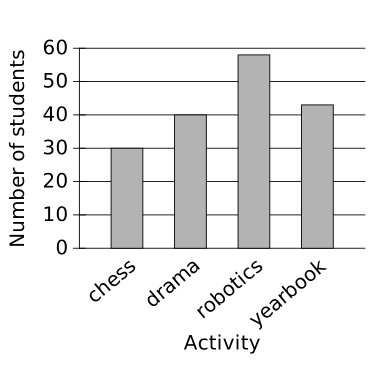
    The bar graph shows the distribution of the number of students in each of four extracurricular activities at a high school. 6050403020100Number of studentschessdramaroboticsyearbook Activity The Number of students data for the 4 bars are as follows: chess: 30 drama: 40 robotics: 58 yearbook: 43 How many more students are in drama than in chess?

    Correct answer: A

    Choice A is correct. It's given that the bar graph shows the distribution of the number of students in each of four extracurricular activities at a high school. The bar representing drama has a height of \(40\); therefore, there are \(40\) students in drama. The bar representing chess has a height of \(30\); therefore, there are \(30\) students in chess. Thus, there are \(40 -30\), or \(10\) more students in drama than in chess. Choice B is incorrect. This is the number of students in chess. Choice C is incorrect. This is the number of students in drama. Choice D is incorrect. This is the sum of the number of students in drama and in chess.
  65. Question 65

    Data value Frequency \(6\) \(3\) \(7\) \(3\) \(8\) \(8\) \(9\) \(8\) \(10\) \(9\) \(11\) \(11\) \(12\) \(9\) \(13\) \(0\) \(14\) \(6\) The frequency table summarizes the \(57\) data values in a data set. What is the maximum data value in the data set?

    Correct answer: C

    The correct answer is \(14\). The maximum value is the largest value in the data set. The frequency refers to the number of times a data value occurs. The given frequency table shows that for this data set, the data value \(6\) occurs three times, the data value \(7\) occurs three times, the data value \(8\) occurs eight times, the data value \(9\) occurs eight times, the data value \(10\) occurs nine times, the data value \(11\) occurs eleven times, the data value \(12\) occurs nine times, the data value \(13\) occurs zero times, and the data value \(14\) occurs six times. Therefore, the maximum data value in the data set is \(14\).
  66. Question 66

    \(4\), \(4\), \(4\), \(4\), \(8\), \(8\), \(8\), \(13\), \(13\) Which frequency table correctly represents the data listed?

    Correct answer: A

    Choice A is correct. A frequency table is a table that lists the data value and shows the number of times the data value occurs. In the data listed, the number \(4\) occurs four times, the number \(8\) occurs three times, and the number \(13\) occurs two times. This corresponds to the table in choice A. Choice B is incorrect. This table has the values for number and frequency reversed. Choice C is incorrect because the frequency values don't represent the data listed. Choice D is incorrect. This table represents the listed number values as the frequency values.
  67. Question 67

    The bar graph summarizes the charge, in kilowatt-hours \((kWh)\), a battery received each day for \(15\) days. 76543210Number of days089111623Charge (kWh)The data for the 6 categories are as follows:0 kilowatt-hours: 68 kilowatt-hours: 19 kilowatt-hours: 211 kilowatt-hours: 416 kilowatt-hours: 123 kilowatt-hours: 1 For how many of these \(15\) days did the battery receive a charge of \(0 kWh\)?

    Correct answer: D

    Choice D is correct. It's given that the bar graph summarizes the charge, in kilowatt-hours \((kWh)\), a battery received each day for \(15\) days. The height of each bar in the bar graph shown represents the number of days the battery received the charge, in \(kWh\), specified at the bottom of the bar. The bar for a charge of \(0 kWh\) reaches a height of \(6\). Therefore, the battery received a charge of \(0 kWh\) for \(6\) of these days. Choice A is incorrect. This is the charge, in \(kWh\), that the battery received, not the number of days the battery received this charge. Choice B is incorrect. This is the number of days the battery received a charge of either \(8\), \(16\), or \(23\) \(kWh\). Choice C is incorrect. This is the number of days the battery received a charge of \(11\) \(kWh\).
  68. Question 68

    The table above shows the distribution of ages of the 20 students enrolled in a college class. Which of the following gives the correct order of the mean, median, and mode of the ages?

    Correct answer: A

    Choice A is correct. The mode is the data value with the highest frequency. So for the data shown, the mode is 18. The median is the middle data value when the data values are sorted from least to greatest. Since there are 20 ages ordered, the median is the average of the two middle values, the 10th and 11th, which for these data are both 19. Therefore, the median is 19. The mean is the sum of the data values divided by the number of the data values. So for these data, the mean is .Since the mode is 18, the median is 19, and the mean is 20, .Choices B and D are incorrect because the mean is greater than the median. Choice C is incorrect because the median is greater than the mode.Alternate approach: After determining the mode, 18, and the median, 19, it remains to determine whether the mean is less than 19 or more than 19. Because the mean is a balancing point, there is as much deviation below the mean as above the mean. It is possible to compare the data to 19 to determine the balance of deviation above and below the mean. There is a total deviation of only 6 below 19 (the 6 values of 18); however, the data value 30 alone deviates by 11 above 19. Thus the mean must be greater than 19.
  69. Question 69

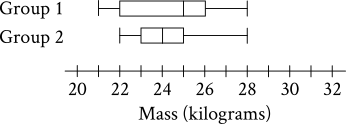
    From left to right the values of the vertical bars in the Group 1 box plot are as follows: First vertical bar: 21 Second vertical bar: 22 Third vertical bar: 25 Fourth vertical bar: 26 Fifth vertical bar: 28 From left to right the values of the vertical bars in the Group 2 box plot are as follows: First vertical bar: 22 Second vertical bar: 23 Third vertical bar: 24 Fourth vertical bar: 25 Fifth vertical bar: 28 The box plots summarize the masses, in kilograms, of two groups of gazelles. Based on the box plots, which of the following statements must be true?

    Correct answer: C

    Choice C is correct. The median of a data set represented in a box plot is represented by the vertical line within the box. It follows that the median mass of the gazelles in group \(1\) is \(25\) kilograms, and the median mass of the gazelles in group \(2\) is \(24\) kilograms. Since \(25\) kilograms is greater than \(24\) kilograms, the median mass of group \(1\) is greater than the median mass of group \(2\). Choice A is incorrect. The mean mass of each of the two groups cannot be determined from the box plots. Choice B is incorrect. The mean mass of each of the two groups cannot be determined from the box plots. Choice D is incorrect and may result from conceptual or calculation errors.
  70. Question 70

    What is the median of the seven data values shown?

    Correct answer: B

    Choice B is correct. When a data set has an odd number of values, the median can be found by ordering the values from least to greatest and determining the value in the middle. Since the values are already presented in order from least to greatest and there are 7 values, the median is the fourth value in the list. Therefore, the median is 3.Choice A is incorrect. This is the mode. Choice C is incorrect. This is the mean. Choice D is incorrect. This is the range.
  71. Question 71

    \(4\), \(10\), \(18\), \(4\), \(4\), \(5\), \(6\), \(5\) What is the median of the data set shown?

    Correct answer: B

    Choice B is correct. If a data set contains an even number of data values, when the data values are listed in ascending or descending order, the median is between the two middle values. The given data set contains \(8\) values. When listed in ascending order, the data set is \(4\), \(4\), \(4\), \(5\), \(5\), \(6\), \(10\), \(18\) and the two middle values are \(5\) and \(5\). Since the two middle values are the same, the median must be \(5\). Choice A is incorrect. This value is between the two middle values in the list shown, not the two middle values when the data values are listed in ascending or descending order. Choice C is incorrect. This is the mean, not the median, of the data set. Choice D is incorrect. This is the range, not the median, of the data set.

Want a higher score?

One-on-one tutoring for SAT, online or in person, with a plan built around the questions you missed.

Get Started

Book Your Free Session

5.0
from 38 Google reviews

Call or Text 1 (888) 356-0607